- Prices still negative but market is turning
- Activity will be boosted by Stamp Duty changes in England
- Southern England yet to flourish
- Average House Price now £357,365 in England & Wales, up 0.2% on November, down 2.0% annually
Richard Sexton, Director at e.surv, comments
“Our data shows house prices in England and Wales closed the year at £357,400, representing a modest month-on-month increase of 0.2%. While values remain approximately 2% lower than a year ago and 6% below their late-2022 peak, the broader picture is one of a market exceeding expectations in terms of activity, mortgage lending, and transaction volumes.
“This year-end performance reflects the stabilising effects of improving consumer confidence and a market that has adjusted to economic challenges. The Chancellor’s announcement on Stamp Duty changes is anticipated to drive a busier start to 2025, as buyers bring forward purchases to avoid the additional SDLT charges from April. However, regional disparities continue to shape the overall picture. Annual price falls for England and Wales stands at -2.0%, but when London and the South East are excluded, the decline narrows to -1.2%, highlighting contrasting regional market dynamics
“Looking ahead, attention will turn to the government’s forthcoming long-term housing plan, which is expected to address affordability challenges and increase housing supply. While the advent of new stock is still some way off , the very clear direction of travel will give buyers cause for optimism in the longer run.
“The housing market in 2024 demonstrated its resilience, and there is cautious optimism for further stability and growth in the year ahead.”
Detailed analysis – The housing market in December
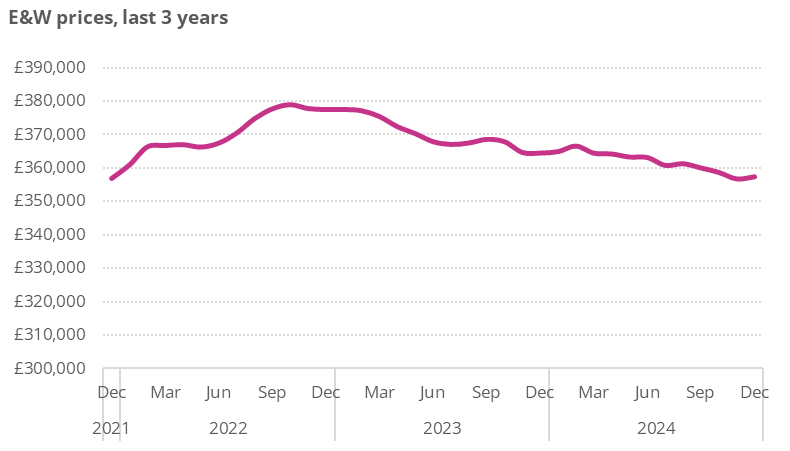
The average sale price of a home in England and Wales nudged a little higher in December – moving up by just over £600 or 0.2% to £357,400.
Despite moving within fairly narrow tramlines over the course of 2024, average prices in December are still about 2% lower than a year ago and on a par with end-2021 values. This contrasts with the more positive reporting from other sources, perhaps reflecting the fact that our figures are based on cash as well as mortgage metrics, in other words a much more rounded perspective on the market. Prices are more than £21,000 (nearly 6%) below the previous peak reached in late 2022, according to Acadata figures.
Table 1. Average House Prices in England and Wales for the year to December 2024
| Month | Year | Property Price | Index | Monthly % change | Annual % change |
| Dec | 2023 | £364,486 | 371.1 | 0.0 | -3.5 |
| Jan | 2024 | £364,924 | 371.6 | 0.1 | -3.3 |
| Feb | 2024 | £366,575 | 373.3 | 0.5 | -2.8 |
| Mar | 2024 | £364,442 | 371.1 | -0.6 | -2.9 |
| Apr | 2024 | £364,209 | 370.9 | -0.1 | -2.2 |
| May | 2024 | £363,295 | 369.9 | -0.3 | -1.9 |
| Jun | 2024 | £363,145 | 369.8 | 0.0 | -1.3 |
| Jul | 2024 | £360,796 | 367.4 | -0.6 | -1.7 |
| Aug | 2024 | £361,295 | 367.9 | 0.1 | -1.7 |
| Sep | 2024 | £360,009 | 366.6 | -0.4 | -2.3 |
| Oct | 2024 | £358,673 | 365.2 | -0.4 | -2.5 |
| Nov | 2024 | £356,730 | 363.3 | -0.5 | -2.2 |
| Dec | 2024 | £357,365 | 363.9 | 0.2 | -2.0 |
Figure 1. Prices move within narrow parameters

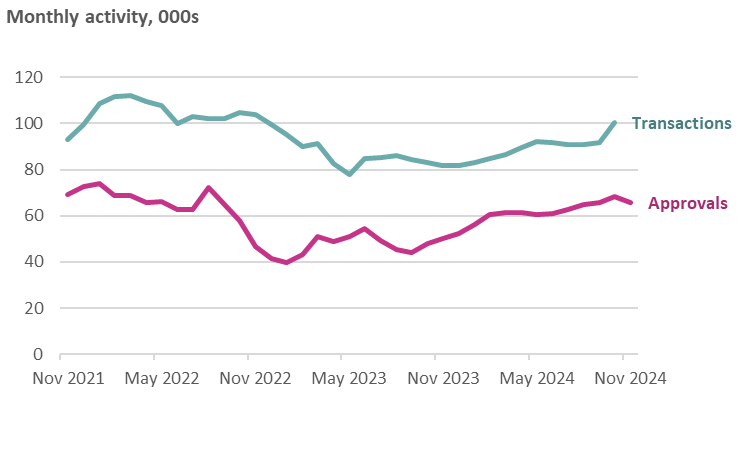
Although not yet underpinning stronger price metrics, housing market activity levels have been on a strengthening trajectory through much of 2024 – see Figure 2. Bank of England figures show mortgage approvals dipping by 2,400 to 65,700 in November. Although only a slight dip (and approvals still being nearly a third higher than a year ago), some market commentators have interpreted this as a reaction to the more sombre economic assessments for the UK following the Autumn Budget.
Figure 2. November’s hiccough in an otherwise improving outlook

Consumer confidence, though still negative is slowly edging upwards along with other signs of housing market activity such as enquiries, instructions and viewings. Indeed what is very evident from all of the year-end commentary is that the housing market in 2024 outperformed expectations by a margin with the year-end outturn being higher than expected in terms of prices, mortgage lending and estimated property transactions.
Looking to 2025, expectations are generally more positive and of course the current market has been boosted by the Chancellor’s announcement at the end of October that the temporary increases in thresholds for Stamp Duty (SDLT) put in place in 2022 would be removed at the end of March. This has resulted in many households bringing forward their purchases to avoid the extra SDLT charge. Based on previous evidence of such moves, the market will be more busy in the run up to 1st April after which it will be quieter than usual for a period of months. Wales has a slightly different regime and there higher rates of land transaction tax announced in December may be made permanent. This will impact on the second homes market and may ease some affordability pressures.
Back in England the long term housing plan is due to be announced probably alongside the spending review in the middle of the year. This will set out the government’s intended policy support towards home ownership alongside its continuing focus on boosting social housing provision.
The English Regions and Wales
Table 2. Average Prices in the English regions and Wales, November 2024
| Geography | Nov 2023 | Oct 2024 | Nov 2024 | Monthly % chg |
Annual % chg |
| East Midlands | £275,258 | £271,894 | £273,841 | 0.7% | -0.5% |
| East of England | £396,340 | £385,935 | £386,034 | 0.0% | -2.6% |
| London | £698,405 | £670,158 | £666,731 | -0.5% | -4.5% |
| North East | £195,520 | £197,610 | £198,733 | 0.6% | 1.6% |
| North West | £251,691 | £252,136 | £253,902 | 0.7% | 0.9% |
| South East | £458,243 | £455,464 | £443,620 | -2.6% | -3.2% |
| South West | £363,442 | £354,226 | £354,696 | 0.1% | -2.4% |
| West Midlands | £284,327 | £283,196 | £282,123 | -0.4% | -0.8% |
| Yorkshire and The Humber | £244,176 | £245,163 | £244,996 | -0.1% | 0.3% |
| England | £371,319 | £365,158 | £363,058 | -0.6% | -2.2% |
| Wales | £241,320 | £238,484 | £239,445 | 0.4% | -0.8% |
| E&W | £364,664 | £358,673 | £356,730 | -0.5% | -2.2% |
House prices in England and Wales continue to be rather subdued compared with Scotland and Northern Ireland.
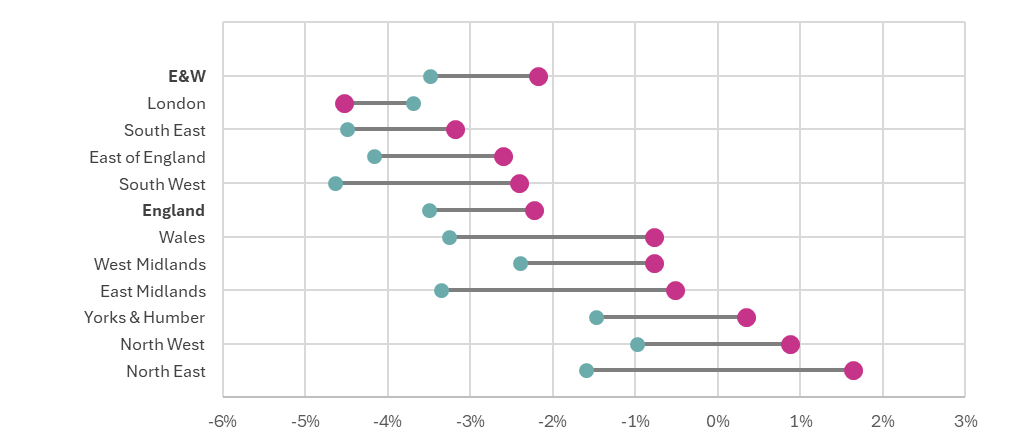
Figure 3. Comparing year-on-year price changes in November 2023 and November 2024
Northern England leads the recovery

Note: Figures are calculated on a rolling three-month basis centred on the middle month, compared with year-earlier periods.
Figure 3 looks at how annual rates of house price inflation in late 2024 compared with a year ago on a regional and country basis.
While market conditions have shown signs of strengthening across most of England and Wales, according to our figures, there are still clear geographic differences. Only northern England was actually in positive territory in November 2024. For the same period, middle England and Wales were in limbo, whilst the regions of southern England continued to see annual prices retreating (if more slowly than a year earlier). The more subdued nature of southern markets probably reflects the more intense affordability pressures and the greater reliance on and sensitivity to the costs of mortgage finance.
Whatever the underlying reasons, weaker prices in southern England and not least in London are a key reason for the overall weakness in our headline England and Wales figures.
The headline 2.0% year-on-year decrease in house prices seen across England and Wales in December would shrink to 1.2% if we exclude London and the South East. While London has been the most significant drag on the market for some while, the dampening effect from the South East, South West and East of England combined is somewhat larger in aggregate.


Comments