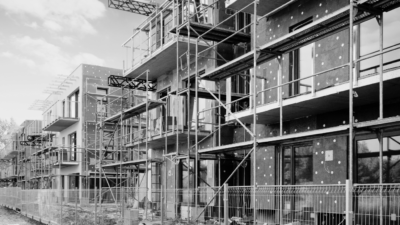
New research has revealed that work was started on £55 billion worth of new-build homes in England during the 2022-23 financial year.
Sourced Franchise has studied new-build start data from the past five years to see how this current period of economic turmoil is affecting the construction rate and sale price of new-build homes in England.
There are varying definitions, but a new-build house or flat is most often counted as a ‘start’ from the moment on-site construction begins.
For example, when the foundations are laid for a block of 100 flats, that is counted as 100 ‘starts’.
In 2022-23, there were 137,800 starts in England. This marks a -1.4% decline from the previous year, but remains the second highest number of starts since 2018.
Regionally, the annual change in the number of new-build starts ranges from a 13.4% increase in London to a -14% drop in Yorkshire & Humber.
Meanwhile, 2022-23 saw a 13.8% annual increase in the average new-build house price, climbing to £399,063.
The South West (16%) recorded the largest annual price growth, followed by the East Midlands (15.9%) and West Midlands (14.8%). England’s lowest growth was recorded in London (9.3%).
The capital, however, remains the most expensive new-build region with an average price of £559,569. This is followed by the South East (£483,944) and the East of England (£469,848).
With a robust level of new homes under construction and new-build house prices continuing to rise, the total estimated value of new-build starts in 2022-23 sits at a whopping £55 billion in England alone.
£11 billion of this value is located in the South East, followed by London (£8.9 billion) and the East (£8.8 billion).
Sourced Franchise Director, Chris Kirkwood, commented:
“It’s great to see that the new-build sector has remained largely undeterred by the current economic landscape and the sector is continuing to push forward to deliver a much needed boost to housing stock levels.
While total starts may have declined marginally year on year, a notable £55bn worth of property is making its way to market, although it’s fair to say that there is quite a disparity in delivery from one region to the next.
This is often the case when it comes to housing delivery and decisions on what to build and where will always be driven by market demand, which in turn, ensures a robust price is achieved when homes do reach the market.”
| Table shows the number of annual new-build dwelling starts in England and its regions, alongside year-on-year change | ||||||
| Location | 2018-19 | 2019-20 | 2020-21 | 2021-22 | 2022-23 | Annual change % |
| London | 11,320 | 9,070 | 10,040 | 14,000 | 15,870 | 13.4% |
| North West | 19,960 | 17,200 | 13,550 | 15,770 | 16,720 | 6.0% |
| South West | 13,960 | 13,190 | 12,810 | 15,380 | 15,840 | 3.0% |
| East Midlands | 12,420 | 12,660 | 11,450 | 17,100 | 16,880 | -1.3% |
| North East | 8,140 | 6,140 | 6,610 | 8,070 | 7,940 | -1.6% |
| East of England | 15,720 | 15,720 | 14,570 | 19,260 | 18,610 | -3.4% |
| South East | 23,830 | 20,260 | 18,990 | 23,910 | 22,890 | -4.3% |
| West Midlands | 13,580 | 12,200 | 10,900 | 12,260 | 11,630 | -5.1% |
| Yorkshire and the Humber | 12,850 | 10,500 | 10,480 | 12,460 | 10,720 | -14.0% |
| England | 135,100 | 119,210 | 111,410 | 139,700 | 137,800 | -1.4% |
| England (sum of regions) | 131,780 | 116,940 | 109,400 | 138,210 | 137,100 | -0.8% |
| Table shows the estimated total value of new-build starts in England in 2022-23 | |||
| Location | Starts number of dwellings – 2022-23 | Ave NB price – 2022-23 | Est total value of starts £ |
| South East | 22,890 | £483,944 | £11,077,471,461 |
| London | 15,870 | £559,569 | £8,880,366,207 |
| East of England | 18,610 | £469,848 | £8,743,876,838 |
| South West | 15,840 | £410,786 | £6,506,850,206 |
| East Midlands | 16,880 | £356,862 | £6,023,838,474 |
| North West | 16,720 | £302,206 | £5,052,886,940 |
| West Midlands | 11,630 | £356,617 | £4,147,450,358 |
| Yorkshire and the Humber | 10,720 | £279,046 | £2,991,373,048 |
| North East | 7,940 | £247,540 | £1,965,470,299 |
| England | 137,800 | £399,063 | £54,990,916,967 |
| England (sum of regions) | 137,100 | £399,063 | £54,711,572,687 |
| Table shows the average new-build price in England since 2018-19, alongside year-on-year change | ||||||
| Location | 2018-19 | 2019-20 | 2020-21 | 2021-22 | 2022-23 | Annual change % |
| South West | £298,567 | £300,683 | £316,269 | £354,125 | £410,786 | 16.0% |
| East Midlands | £257,765 | £261,046 | £275,797 | £308,005 | £356,862 | 15.9% |
| West Midlands | £263,730 | £266,932 | £279,167 | £310,587 | £356,617 | 14.8% |
| North West | £216,504 | £221,189 | £235,645 | £263,710 | £302,206 | 14.6% |
| East of England | £360,475 | £358,920 | £371,185 | £411,519 | £469,848 | 14.2% |
| Yorkshire and the Humber | £202,492 | £207,188 | £219,224 | £244,615 | £279,046 | 14.1% |
| North East | £185,277 | £186,916 | £195,805 | £218,039 | £247,540 | 13.5% |
| South East | £375,379 | £373,228 | £386,789 | £426,762 | £483,944 | 13.4% |
| London | £490,166 | £486,398 | £497,248 | £511,969 | £559,569 | 9.3% |
| England | £302,753 | £304,369 | £318,180 | £350,742 | £399,063 | 13.8% |


Comments