- Rising prices in 18 local authorities; two more than January
- Inverclyde has highest annual growth rate in February at 11.4%
- Transactions remain low due to affordability issues
- Average Scottish house price now stands at £220,736, down 0.2% on January, up 0.4% annually
Scott Jack, Regional Development Director at Walker Fraser Steele, comments:
“Our analysis this month reveals a small fall in the average house price for February of some £400, or -0.2%. The average is now £220,736.
Of note is the fact that this the fifth monthly fall in prices in a row, but given just how many headwinds the market and home buyers have faced, the total reduction in prices – since they peaked in June 2023 at £223,800 – only amounts to £3,000, or 1.4%.
Housing remains remarkably resilient and we are also expecting some of the better market news of recent weeks may positively impact pricing in the coming months. Mortgage approvals across the UK are up 39% compared to the same period last year and this should feed into better completion figures and support prices.
The signs of improvement are already there with 18 local authority areas seeing prices rises in February – two more than in the previous month. Notably Edinburgh also saw prices rise in February.
It’s also worth noting that on an annual basis, Scotland’s rate of growth turned positive in February 2024, up by £920, or +0.4% from one year earlier.”
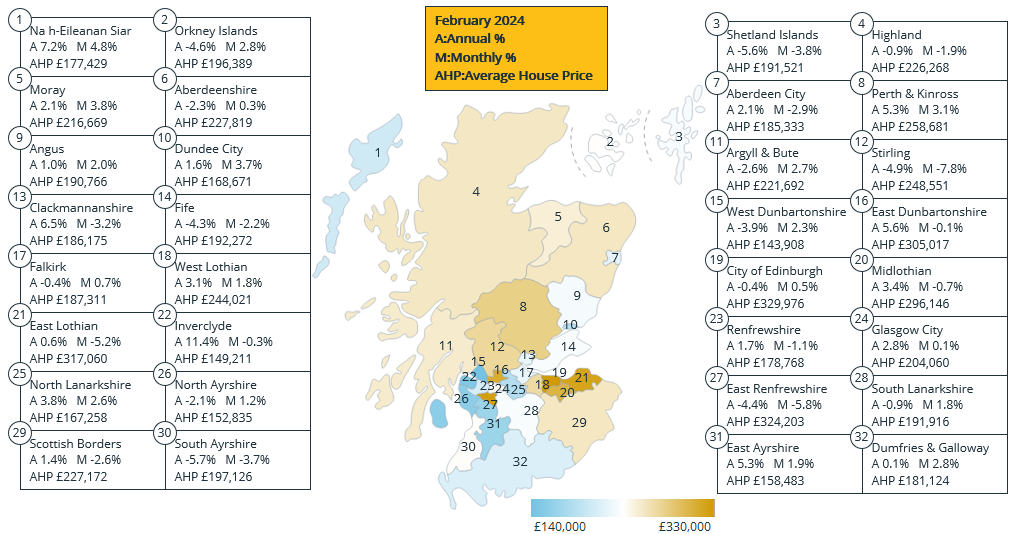
Table 1. Average House Prices in Scotland for the period February 2023 – February 2024
| Month | Year | House Price | Index | Monthly Change % | Annual Change % |
| February | 2023 | £219,815 | 287.9 | -0.6 | 2.8 |
| March | 2023 | £219,546 | 287.5 | -0.1 | 1.3 |
| April | 2023 | £221,163 | 289.7 | 0.7 | 1.5 |
| May | 2023 | £223,383 | 292.6 | 1.0 | 1.6 |
| June | 2023 | £223,798 | 293.1 | 0.2 | 1.4 |
| July | 2023 | £223,264 | 292.4 | -0.2 | 0.4 |
| August | 2023 | £223,044 | 292.1 | -0.1 | 0.4 |
| September | 2023 | £223,699 | 293.0 | 0.3 | 0.6 |
| October | 2023 | £223,268 | 292.4 | -0.2 | 0.4 |
| November | 2023 | £222,819 | 291.8 | -0.2 | 0.1 |
| December | 2023 | £221,508 | 290.1 | -0.6 | -0.4 |
| January | 2024 | £221,130 | 289.6 | -0.2 | 0.0 |
| February | 2024 | £220,736 | 289.1 | -0.2 | 0.4 |
Commentary: John Tindale, Acadata Senior Housing Analyst
February’s housing market
Scotland’s average house price fell in February by some £400, or -0.2%, and now stands at £220,736. This is the fifth monthly fall in prices in a row, and is the first time that the average price has been below £221,000 since March 2023 – almost one year earlier. However, the total reduction in prices – since they peaked in June 2023 at £223,800 – only amounts to £3,000, or 1.4%. It is therefore possible that this shortfall from the peak could be rectified in March 2024 if some of the more favourable factors seen in February continue to apply. For example, 18 local authority areas saw prices rise in February 2024, which was two more than in the previous month. Edinburgh also saw prices rise in February 2024, after they had fallen by some -£9,000 over the previous two months. Edinburgh has consequently returned to being the authority with the highest average house price (see Table2), having been in second or third place over the previous five months.
On an annual basis, Scotland’s rate of growth turned positive in February 2024, up by £920, or +0.4% from one year earlier, having been at zero % growth in January 2024, and negative at -0.4% in December 2023.
It should also be borne in mind that January and February are typically the weakest months of the year in Scotland’s housing market in terms of transaction levels, which is in part to do with Christmas, since many estate agents remain closed over the holiday period. When sales levels are low, minor trends – which might otherwise have been obscured by the larger number of sales that take place in the other months of the year – can stand out. For example, in February 2024 a three-bedroom detached cottage on the Isle of Harris sold for £417k, which ordinarily in the summer months might have gone unnoticed. However, being a February sale this purchase propelled Na h-Eileanan Siar into first place, with the highest monthly growth rate and second place for the next-to-highest annual growth rate of all 32 local authority areas in Scotland.
Figure 1. Scotland’s average house price for the period from March 2020 to February 2024
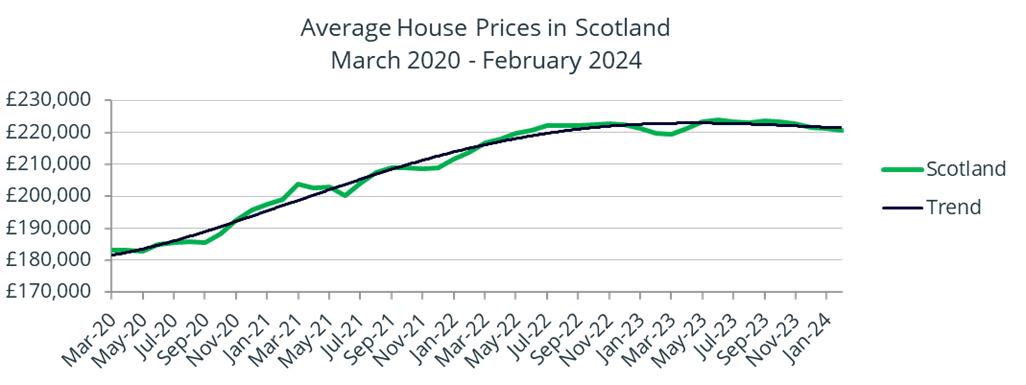
Figure 1 shows how average house prices in Scotland have changed over the near four years from the start of the pandemic in March 2020 to February 2024. Prices have increased by some £37,700, or 20.6% over this period. This compares to a movement of 20.4% in the CPIH Index over the same period – suggesting that the value of a home in Scotland has kept pace with inflation.
It can be seen from Figure 1 that values have generally been “flat-lining” over the last two years, with prices having first reached the current level of £220,736 in June 2022, some twenty months earlier.
Local Authority Analysis
Table 2. Average House Prices in Scotland, by local authority area, comparing February 2023 with January and February 2024
| Prior Year Rank | Rank By Price | Local Authority Area | Feb-23 | Jan-24 | Feb-24 | Month % Change | Annual % Change |
| 2 | 1 | City of Edinburgh | £331,236 | £328,359 | £329,976 | 0.5% | -0.4% |
| 1 | 2 | East Renfrewshire | £339,167 | £344,059 | £324,203 | -5.8% | -4.4% |
| 3 | 3 | East Lothian | £315,260 | £334,382 | £317,060 | -5.2% | 0.6% |
| 4 | 4 | East Dunbartonshire | £288,802 | £305,250 | £305,017 | -0.1% | 5.6% |
| 5 | 5 | Midlothian | £286,465 | £298,211 | £296,146 | -0.7% | 3.4% |
| 7 | 6 | Perth and Kinross | £245,593 | £250,828 | £258,681 | 3.1% | 5.3% |
| 6 | 7 | Stirling | £261,481 | £269,476 | £248,551 | -7.8% | -4.9% |
| 8 | 8 | West Lothian | £236,621 | £239,788 | £244,021 | 1.8% | 3.1% |
| 9 | 9 | Aberdeenshire | £233,121 | £227,037 | £227,819 | 0.3% | -2.3% |
| 12 | 10 | Scottish Borders | £224,127 | £233,339 | £227,172 | -2.6% | 1.4% |
| 10 | 11 | Highland | £228,259 | £230,629 | £226,268 | -1.9% | -0.9% |
| 11 | 12 | Argyll and Bute | £227,544 | £215,849 | £221,692 | 2.7% | -2.6% |
| 13 | 13 | Moray | £212,186 | £208,652 | £216,669 | 3.8% | 2.1% |
| 18 | 14 | Glasgow City | £198,440 | £203,935 | £204,060 | 0.1% | 2.8% |
| 14 | 15 | South Ayrshire | £208,969 | £204,649 | £197,126 | -3.7% | -5.7% |
| 15 | 16 | Orkney Islands | £205,910 | £191,038 | £196,389 | 2.8% | -4.6% |
| 17 | 17 | Fife | £200,892 | £196,681 | £192,272 | -2.2% | -4.3% |
| 19 | 18 | South Lanarkshire | £193,597 | £188,549 | £191,916 | 1.8% | -0.9% |
| 16 | 19 | Shetland Islands | £202,906 | £199,097 | £191,521 | -3.8% | -5.6% |
| 20 | 20 | Angus | £188,823 | £187,059 | £190,766 | 2.0% | 1.0% |
| 21 | 21 | Falkirk | £188,125 | £185,933 | £187,311 | 0.7% | -0.4% |
| 25 | 22 | Clackmannanshire | £174,750 | £192,263 | £186,175 | -3.2% | 6.5% |
| 22 | 23 | Aberdeen City | £181,606 | £190,894 | £185,333 | -2.9% | 2.1% |
| 23 | 24 | Dumfries and Galloway | £180,981 | £176,133 | £181,124 | 2.8% | 0.1% |
| 24 | 25 | Renfrewshire | £175,858 | £180,792 | £178,768 | -1.1% | 1.7% |
| 27 | 26 | Na h-Eileanan Siar | £165,573 | £169,264 | £177,429 | 4.8% | 7.2% |
| 26 | 27 | Dundee City | £165,969 | £162,636 | £168,671 | 3.7% |
…















Comments